

Table of Contents
- The Challenge: The Loop Nobody Closes
- The Starting Point: Porting the Agent (and Why There Was No Alternative)
- Step-by-Step Implementation
- Results: What the Optimizer Found
- Validation: Bundles, A/B, and the Uncomfortable Verdict
- Promotion: Where the CLI Fell Short
- Lessons Learned
- Conclusion
- Official Resources 📚
I closed the Episodic Memory article with a line that kept nagging me for months: “there’s a point in an agent’s development where you can’t keep improving it with prompts alone.”
At the time I offered one answer: let the agent learn from its own experience. But there was another answer I left hanging, and it’s a lot more uncomfortable: what if the problem isn’t that the prompt falls short, but that I’m not the right person to keep writing it?
Think about it for a second. When you tweak the system prompt of a production agent, what are you basing it on? The three or four cases you remember going wrong. The intuition that “this instruction should help.” A handful of manual tests you ran after the change. Never the 200 real traces sitting in CloudWatch waiting for someone to read them.
Amazon Bedrock AgentCore Optimization proposes exactly that: have a model read the traces for you, find the failure pattern, and hand you back an improved prompt. And then — this is the part that really got me interested — validate that change with an A/B test on real traffic, with statistical significance, before you commit to it.
I ran the whole thing on the same DevOps agent from the series. Here’s what happened: the recommendation turned out to be surprisingly good, the A/B test told me there wasn’t enough evidence to declare it a winner, and along the way I logged every trap the documentation doesn’t mention — they’re scattered as ProTips throughout the article. All the code is at github.com/codecr/agentcore-optimization-loop.
🎯 ProTip #1: Watch the maturity status closely, because it changed recently and a lot of what you’ll find written about it is out of date. Per the release notes, the Agent Optimization Loop entered public preview in April 2026, but Recommendations, A/B Testing, and Batch Evaluations reached GA in June 2026. The only piece still in preview is Failure Insights, and AgentCore Evaluations — the foundation all of this sits on — has been GA since March 2026. This is no longer a preview toy: it’s production surface. That said, GA doesn’t mean complete. In my account, calls to these APIs didn’t show up in CloudTrail’s event history, and while the docs have dedicated CloudTrail pages for Gateway, Runtime, and Harness, I couldn’t find the equivalent for optimization. I’m not claiming the support doesn’t exist; I’m claiming I didn’t see it. If your process requires an audit trail of who changed an agent’s configuration, verify it in your own account before assuming it — that’s precisely one of the selling points of configuration bundles.
🔄 Update (September 2026): Verified as of early September — Failure Insights is still in public preview, no status change since I wrote this. What did change is the name and scope: the current documentation presents it as “AgentCore insights”, with three analysis types instead of one — failure analysis (what this article describes as Failure Insights), user intent analysis, and execution/trajectory summary. All three remain in public preview and are configured from the same Optimizations section of the console. Nothing I say about Failure Insights below changed in behavior, only the name AWS groups it under.
The Challenge: The Loop Nobody Closes
Most teams I know have the first two pieces of the loop and are missing the third.
They observe: they have observability, traces in CloudWatch, dashboards. They evaluate: if they’ve already read the AgentCore Evaluations article, they have quality scores running against real traffic. But when it comes time to improve, the loop breaks and goes back to being artisanal: someone opens the prompt file, writes a few new lines based on their personal reading of the data, and deploys hoping for the best.
AgentCore Optimization attacks that last stretch with three capabilities that work together:
Recommendations — You point it at your agent’s traces in CloudWatch Logs and tell it which evaluator to optimize for. The service analyzes the failure patterns and hands back an optimized system prompt (or more precise tool descriptions), along with an explanation of what changed and why.
Configuration bundles — Immutable, versioned snapshots of your agent’s configuration: system prompts, model IDs, tool descriptions. The git analogy isn’t mine and isn’t approximate — it’s literally the data model. Every version carries a commitMessage, and parentVersionIds is documented as “regular commits have a single parent; merge commits have two: the parent of the destination branch and the parent of the source branch.” There’s a branchName, which inherits the parent’s branch if omitted or falls back to a default called mainline. And the CLI exposes agentcore cb versions and agentcore cb diff --from <v1> --to <v2>. All of that is in the UpdateConfigurationBundle reference and the CloudFormation VersionLineageMetadata type. They decouple agent behavior from code, so you can change how it responds without redeploying. They’re optional: you can also validate by deploying to a separate runtime endpoint.
A/B testing — Splits live traffic between two variants through the AgentCore Gateway. Assignment is sticky by session ID, online evaluation scores each session, and the service computes the mean, percentage change, p-value, confidence interval, and a significance flag.
Put together, the promise is a self-feeding loop: the winning variant’s traces become the new baseline for the next recommendation.
🔍 ProTip #2: The evaluator you pick is the optimization’s objective function. The optimizer pushes the prompt toward whatever that evaluator scores highly, for better and for worse. If your agent has a clear task to complete,
Builtin.GoalSuccessRateis the right signal. If it’s more open-ended and you care about interaction quality,Builtin.Helpfulnessfits better. Choosing wrong here doesn’t give you a bad prompt — it gives you an excellent prompt for the wrong metric.
The Starting Point: Porting the Agent (and Why There Was No Alternative)
Here comes the first hard lesson of the exercise, and it arrived before writing a single line of new code.
The DevOps agent from the Memory series was a local Flask app calling Bedrock Converse directly. It worked perfectly for what that article needed. But it can’t enter the optimization loop, for two non-negotiable reasons:
- Recommendations and online evaluation read traces from CloudWatch under the service-name convention
{RuntimeName}.DEFAULT. That implies an agent deployed on AgentCore Runtime with observability, or a supported framework (Strands Agents, or LangGraph with OpenTelemetry/OpenInference instrumentation). - For the A/B test to be able to swap the system prompt between variants, the agent has to read its prompt from the configuration bundle at runtime, not have it hardcoded.
So “reusing my agent” actually meant porting it to Strands on AgentCore Runtime. It wasn’t a tweak — it was a port.
Tools With the Strands Decorator
When porting to Strands, tools are wired up with the @tool decorator and the framework handles the rest:
@tool
def describe_rds_metrics(instance_id: str, period_minutes: int = 30) -> dict:
    """Gets CloudWatch metrics for an RDS instance: connections, CPU,
    free memory, and read/write latencies. Use it when the incident
    involves timeouts, saturation, or database slowness.

    Args:
        instance_id: The RDS instance identifier (e.g. prod-db-1).
        period_minutes: Lookback window in minutes.
    """
    end_time = datetime.now(timezone.utc)
    start_time = end_time - timedelta(minutes=period_minutes)
    metrics = ["DatabaseConnections", "CPUUtilization", "FreeableMemory",
               "ReadLatency", "WriteLatency"]
    result = {}
    for name in metrics:
        try:
            resp = _cloudwatch.get_metric_statistics(
                Namespace="AWS/RDS",
                MetricName=name,
                Dimensions=[{"Name": "DBInstanceIdentifier", "Value": instance_id}],
                StartTime=start_time,
                EndTime=end_time,
                Period=300,
                Statistics=["Average", "Maximum"],
            )
            if resp["Datapoints"]:
                latest = sorted(resp["Datapoints"], key=lambda x: x["Timestamp"])[-1]
                if name == "FreeableMemory":
                    result[f"{name}_GB"] = round(latest["Average"] / (1024 ** 3), 2)
                elif "Latency" in name:
                    result[f"{name}_ms"] = round(latest["Average"] * 1000, 2)
                else:
                    result[name] = round(latest["Average"], 2)
            else:
                result[name] = None
        except Exception as e:
            # If the runtime role lacks permissions, this surfaces as data, not a crash
            result[name] = f"Error: {e}"
    return result
That docstring detail isn’t cosmetic: in Strands, the tool description is what the model sees to decide whether to use it. It’s literally the artifact that the tool-descriptions recommendation optimizes.
The Hook That Reads the Bundle
The key piece of the port is the BeforeModelCallEvent hook. It fires before every model call and applies the active bundle’s system prompt:
def _resolve_system_prompt() -> str:
    """Reads the base system prompt from the config bundle; falls back to DEFAULT."""
    try:
        config = BedrockAgentCoreContext.get_config_bundle()
        return config.get("system_prompt", DEFAULT_SYSTEM_PROMPT) if config else DEFAULT_SYSTEM_PROMPT
    except Exception:
        # Defensive fallback: never leave the agent without a prompt
        return DEFAULT_SYSTEM_PROMPT


def dynamic_config_hook(event: BeforeModelCallEvent):
    """Before every model call, apply the active bundle's prompt.
    During an A/B test, the Gateway propagates which bundle version
    (control or treatment) this session belongs to via baggage, and this is
    where it gets materialized.
    """
    event.agent.system_prompt = _resolve_system_prompt()


agent = Agent(
    model=BedrockModel(model_id=DEFAULT_MODEL_ID),
    tools=TOOLS,
    system_prompt=DEFAULT_SYSTEM_PROMPT,
)
agent.hooks.add_callback(BeforeModelCallEvent, dynamic_config_hook)
The elegant part of the design: the agent’s code never knows which variant it’s in. The Gateway assigns the session, injects the bundle reference via W3C Baggage headers with two keys — aws.agentcore.configbundle_arn and aws.agentcore.configbundle_version — the BedrockAgentCoreApp parses them, resolves the version against the control plane, caches the result, and get_config_bundle() returns the configuration for the component that matches your runtime ARN. If there’s no bundle reference in the request, it returns an empty dictionary and falls back to the default.
Worth clarifying: I didn’t invent this pattern — the BeforeModelCallEvent hook is exactly the pattern recommended in the documentation for Strands agents, and the docs also show the variants for LangGraph, Google ADK, and the OpenAI SDK. If you need to apply more fields than just the prompt — model ID, temperature, tools — the docs suggest building the agent per request instead of using the hook. A useful extra I found while reading it: there’s a get_config_bundle_ref() for inspecting the raw reference (bundle_id, bundle_arn, bundle_version), which is the clean way to log which variant a session ran under without the agent changing its behavior by knowing it. And to test locally you can pass baggage= by hand to invoke_agent_runtime, without spinning up a full A/B test.
⚠️ ProTip #3:
get_config_bundle()exists starting withbedrock-agentcore >= 1.8.0. This floor actually is documented: the A/B testing prerequisites require “AgentCore SDK (version 1.8+)” because the SDK’sBaggageSpanProcessoris what attaches the experiment ARN and variant name to OpenTelemetry spans. I had to figure out the other two floors the hard way, and they don’t fail obviously if you fall short:strands-agents[otel] >= 1.13.0andbotocore[crt] >= 1.35.0. And always wrap the read in a try/except with defaults — if the call to the control plane fails, the exception propagates and takes down the whole invocation.
The Decision to Turn Memory Off
I made a decision worth explaining because it goes against intuition: I kept episodic memory off during the A/B test.
The reason is purely experimental. The dynamic injection of episodes and reflections changes each session’s context based on whatever semantic search retrieves at that moment. That introduces variance that has nothing to do with the change I’m measuring. If control and treatment differ in the base prompt and also in which experiences they retrieved, I can no longer attribute the difference to the prompt.
With memory off, the only thing that differs between C and T1 is the system prompt. A clean A/B. In normal operation it’s turned on with ENABLE_MEMORY=true.
🧪 ProTip #4: Any component that adds per-session variance — episodic memory, RAG with dynamic retrieval, user context — makes your A/B test more expensive in samples. It’s not that having it on is wrong; it’s that you need more sessions to separate signal from noise. If your experiment is about the prompt, isolate the prompt.
Step-by-Step Implementation
The whole path goes through the AgentCore CLI, which manages a CDK stack under the hood. This was my first architecture decision of the exercise, and I changed it partway through: my convention is Terraform, but provider support for AgentCore’s newer capabilities lags behind, and the CLI already has first-class commands for bundles, online eval, and A/B tests. I fought less and got further.
Step 1: Provision Runtime, Online Eval, and Gateway
# Agent project and runtime
agentcore create --name DevOpsOptimizationLoop --no-agent
cd DevOpsOptimizationLoop

agentcore add agent \
  --name devopsAgent \
  --language Python \
  --framework Strands \
  --model-provider Bedrock \
  --memory none \
  --build CodeZip

agentcore deploy

# Online evaluation: scores every session live
agentcore add online-eval \
  --name devopsEval \
  --runtime devopsAgent \
  --evaluator "Builtin.GoalSuccessRate" \
  --sampling-rate 100.0 \
  --enable-on-create

# Gateway and target: config-bundle A/B routes through here
agentcore add gateway --name devopsGateway

agentcore add gateway-target \
  --name devops-diag \
  --gateway devopsGateway \
  --type http-runtime \
  --runtime devopsAgent

agentcore deploy
The --sampling-rate 100.0 is deliberate. In normal production you’d use 10% or less for cost reasons, but during an A/B test you want every session scored: the more scored samples, the sooner you reach significance. You dial it back down once the experiment ends.
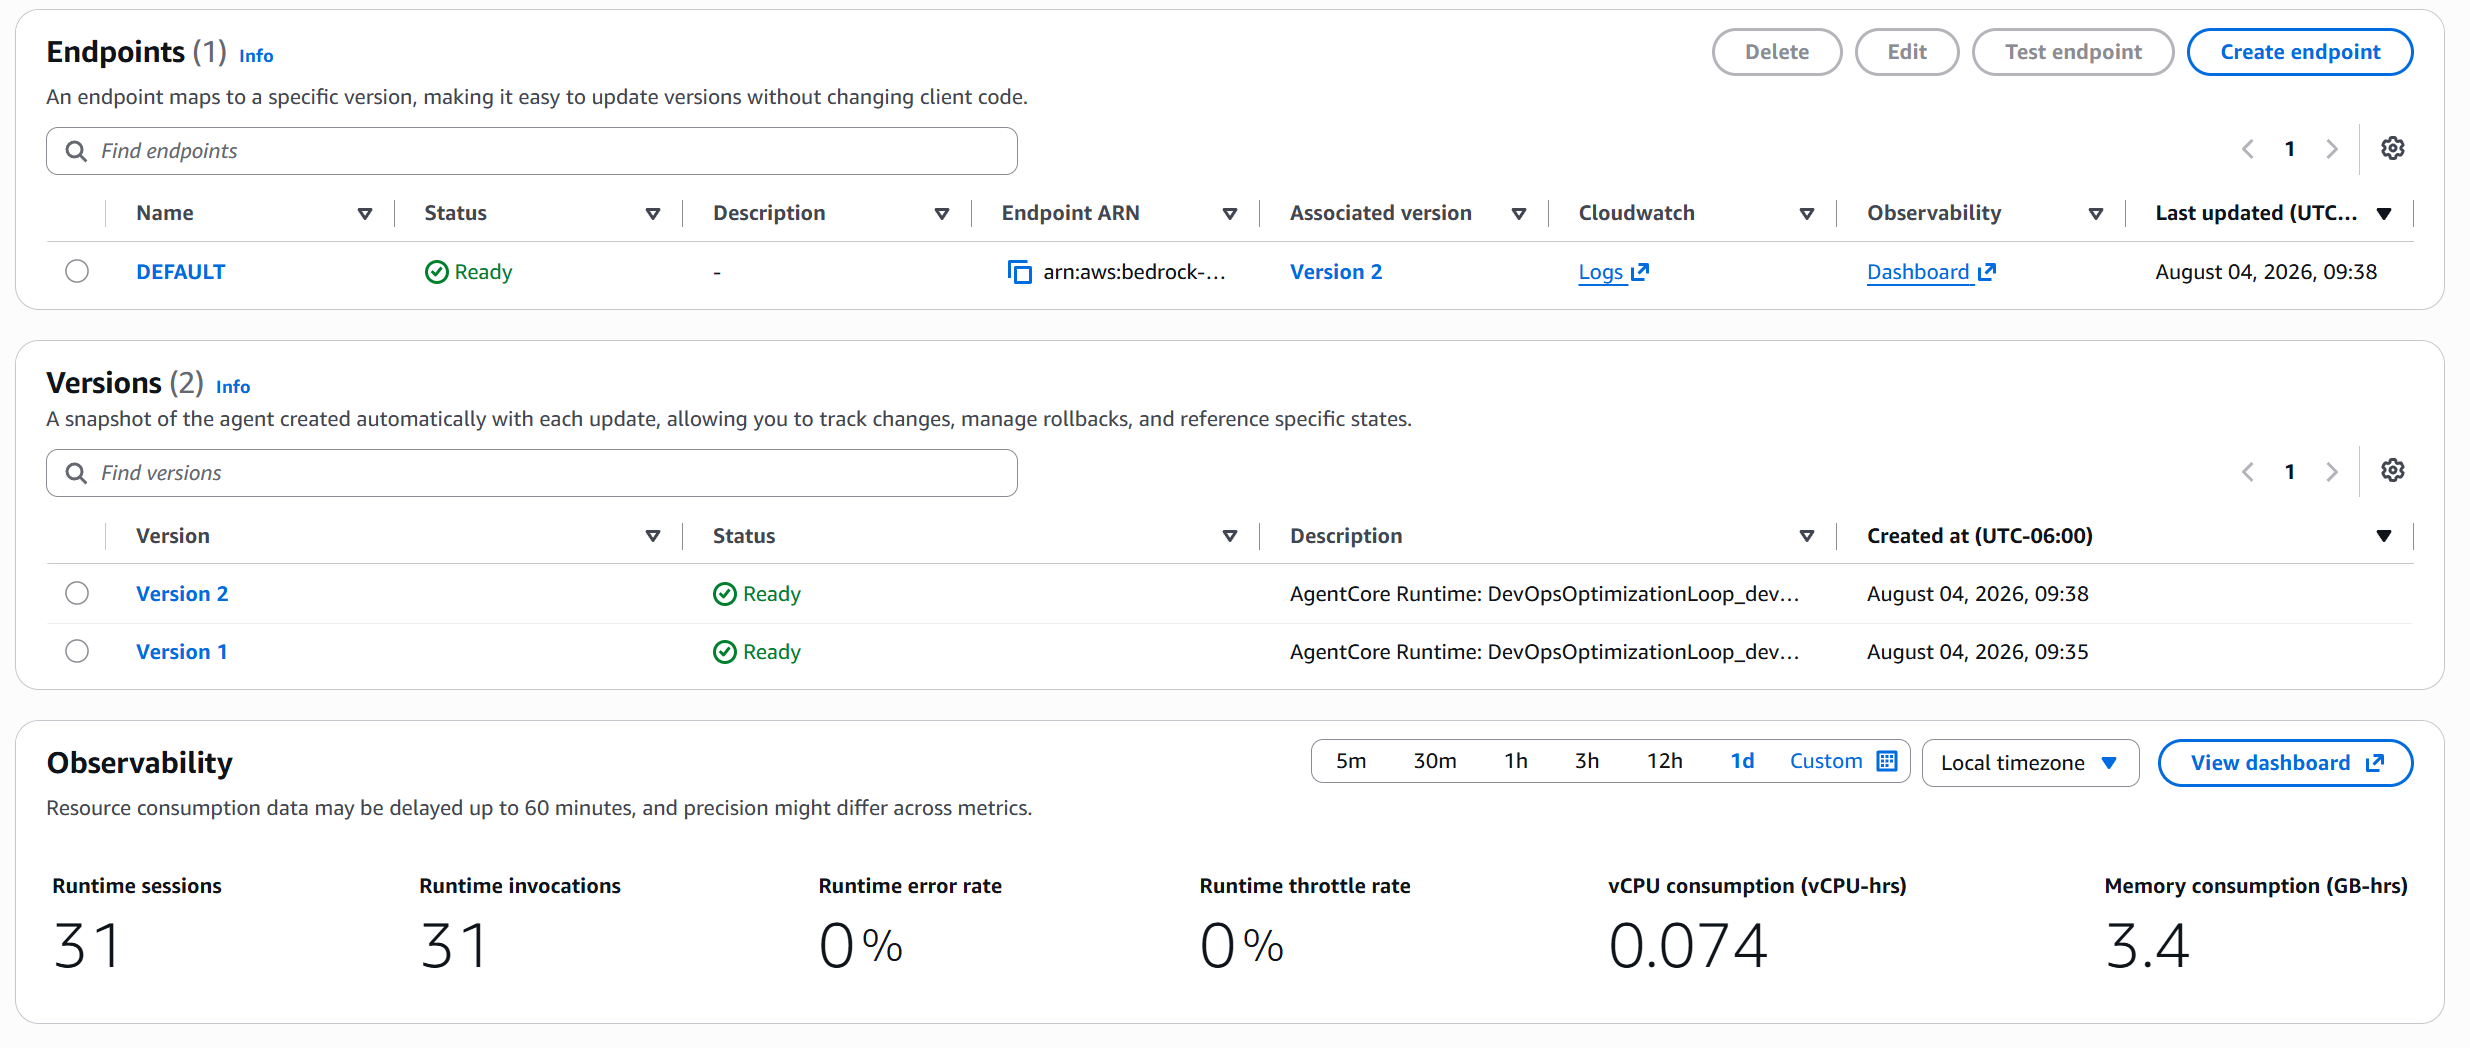 Figure 1: The runtime during the baseline phase — 31 sessions and 31 invocations. Note there are already two runtime versions: every
 agentcore deploy generates a versioned snapshot, and the DEFAULT endpoint points to Version 2.
That consumption of 0.074 vCPU-hrs and 3.4 GB-hrs for 31 invocations gives a sense of the runtime’s compute cost, which is separate from inference cost. The console warns that consumption data can lag by up to 60 minutes.
A bookkeeping detail so the numbers in the article add up: the counter keeps climbing throughout the exercise. The seed is 30 invocations, this screenshot shows 31, and the final cost breakdown lands on 32 because it includes the checks I made after taking the screenshot.
Step 2: Generate the Baseline
The recommendation needs traces to analyze, so the agent has to do some work first. My script runs through ten real DevOps incidents across several rounds:
# 3 rounds × 10 incidents = 30 direct invocations to the runtime
./seed_traffic.sh ../../incidents.txt 3
The incidents are from the real domain, not “hello world”: “We’re seeing intermittent timeouts on checkout-api against the prod-db-1 RDS instance,” “payment-service has had connection errors for the last 10 minutes,” “Aurora prod-db-1 shows 95% connection utilization — should I scale or is there another cause?”
🔧 ProTip #5: After invoking, wait 2 to 5 minutes before launching the recommendation. CloudWatch needs time to ingest the telemetry, and if you fire too early the service simply doesn’t find enough traces. You also need Transaction Search enabled in CloudWatch — and there’s a trap there that cost me time, see ProTip #10.
With traffic flowing, the online evaluation dashboard started showing the baseline:
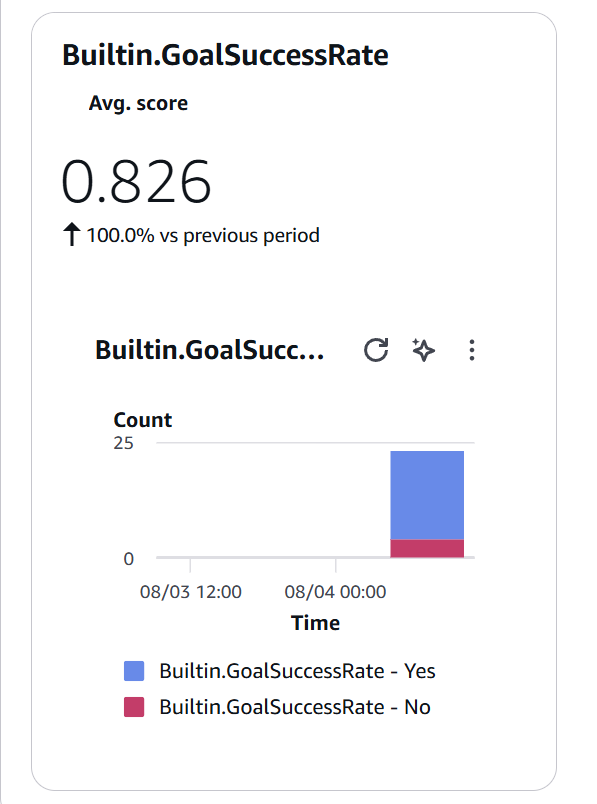 Figure 2: Baseline for the
 Builtin.GoalSuccessRate evaluator — an average score of 0.826 over that window, with the Yes/No distribution that characterizes this binary, session-level evaluator.
A score of 0.826 isn’t bad. And here’s the conceptual trap of the whole exercise, so I’ll state it up front: the higher your agent starts, the harder it is to statistically prove you improved it. I’ll come back to this.
📊 ProTip #6: Don’t mix the online-evaluation widget score with the A/B test numbers. They’re different time windows, samples, and contexts. In my run, the widget showed 0.826 over the baseline window, the recommendation reported 16 successes out of 20 analyzed traces (0.80), and the A/B test measured 0.94 for control over 103 sessions. All three numbers are correct and none of them is the other. Every time you cite one, cite which screen it came from and over how many sessions — without that, any of the three can pass for “the agent’s score.”
Step 3: Request the Recommendation
agentcore run recommendation \
  --type system-prompt \
  --run devops-prompt-rec \
  --runtime devopsAgent \
  --evaluator Builtin.GoalSuccessRate \
  --prompt-file ../../bundles/control_prompt.txt \
  --lookback 7
Under the hood, the CLI resolves the log group ARNs and service names from the runtime configuration, and builds a call equivalent to this:
response = client.start_recommendation(
    name="devops-prompt-rec",
    type="SYSTEM_PROMPT_RECOMMENDATION",
    recommendationConfig={
        "systemPromptRecommendationConfig": {
            "systemPrompt": {"text": prompt_actual},
            "agentTraces": {
                "cloudwatchLogs": {
                    "logGroupArns": ["<log-group-arn>"],   # ARNs, not names
                    "serviceNames": ["devopsAgent.DEFAULT"],  # verify the actual value
                    "startTime": now - timedelta(days=7),
                    "endTime": now,
                }
            },
            "evaluationConfig": {
                "evaluators": [
                    {"evaluatorArn": "arn:aws:bedrock-agentcore:::evaluator/Builtin.GoalSuccessRate"}
                ]
            },
        }
    },
    clientToken=str(uuid.uuid4()),
)
Don’t copy that serviceNames blindly. The CLI resolves it for you, but if you build the call by hand you need the literal name your runtime emits telemetry under, and that name carries whatever prefixes and suffixes your project adds — in my account the console shows the runtime as DevOpsOptimizationLoop_dev, not devopsAgent. Get this wrong and you don’t get an error: you get zero traces and a recommendation that never starts, which is the worst possible failure mode to debug.
And here’s where the exercise’s pleasant surprise showed up.
Results: What the Optimizer Found
The service analyzed twenty trajectories: sixteen successes and four failures. Twenty isn’t the number of traces I seeded — it’s the maximum the service samples per recommendation; more on that below. And in those four failures it found a pattern I hadn’t seen, even though the data had been sitting there all afternoon.
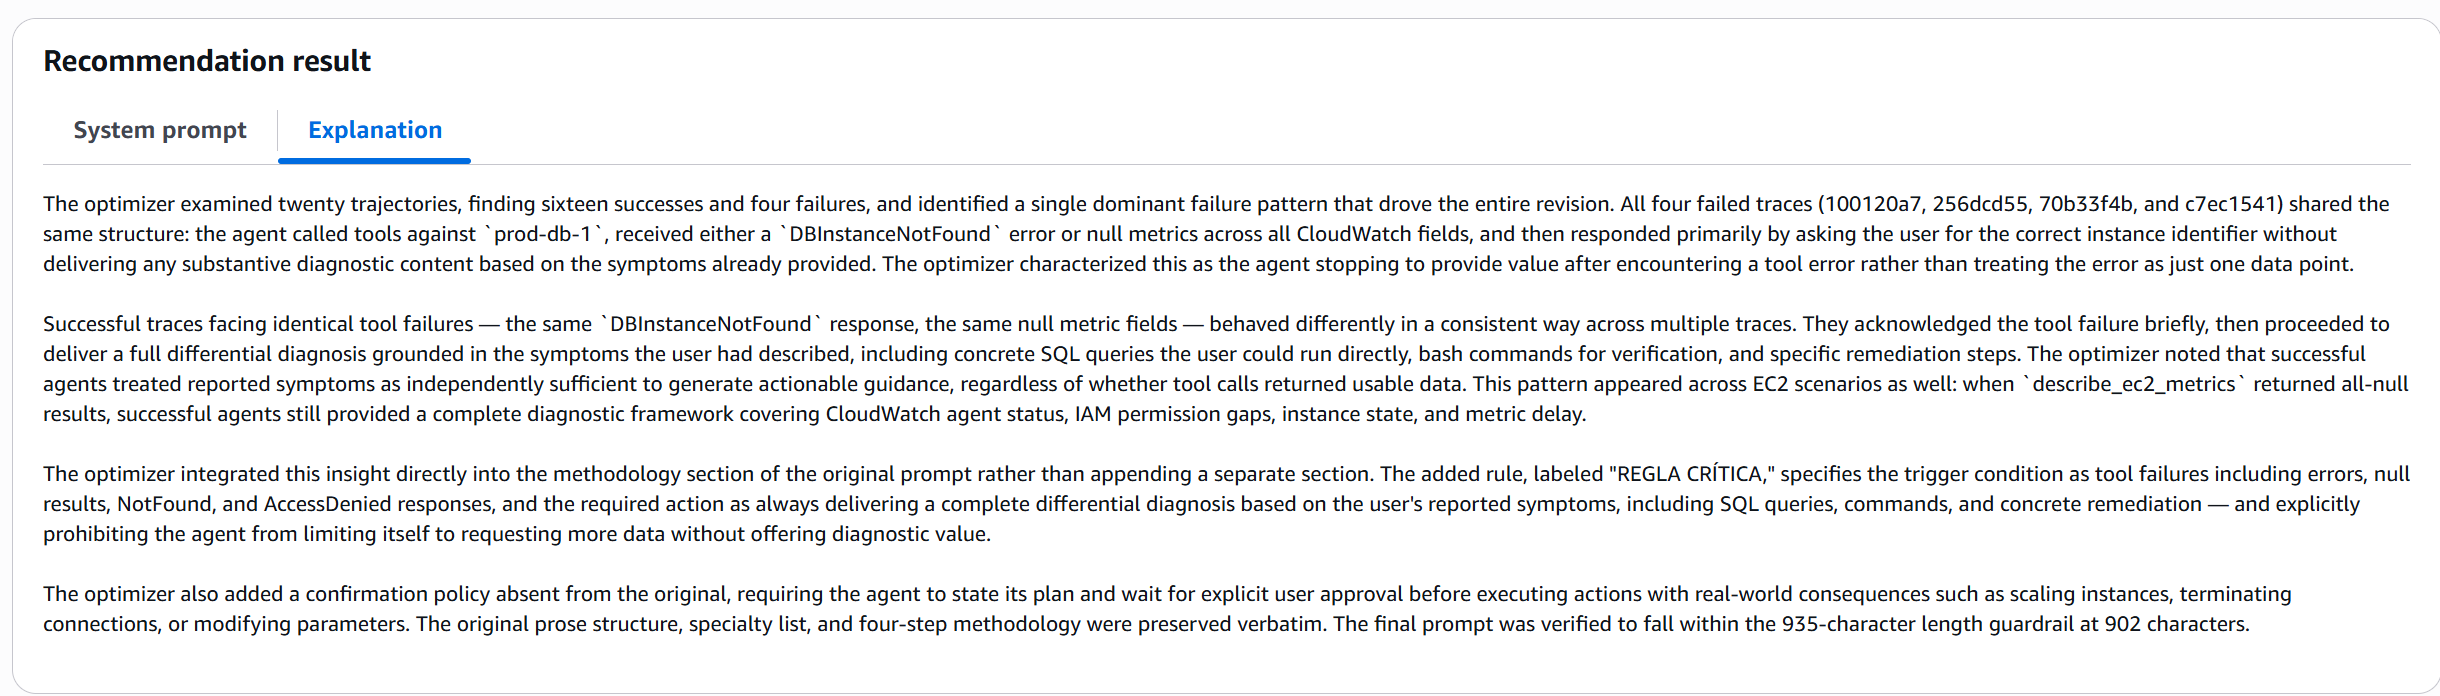 Figure 3: The Explanation tab of the result — the optimizer identifies a single dominant failure pattern, cites the four specific traces, and explains how the successful trajectories differed when they faced the same tool error.
The reasoning, summarized: the four failed traces shared the same structure. The agent called tools against prod-db-1, got a DBInstanceNotFound error or null values across all CloudWatch fields, and then responded by asking for the correct instance identifier without delivering any diagnostic content about the symptoms the user had already described.
(An honest aside: prod-db-1 and i-0abc123def456 are fictional identifiers from my lab. Those tool errors are expected. The interesting part isn’t that they failed — it’s what the agent did when they did.)
Because the optimizer also looked at the successful traces that hit the exact same failure — the same DBInstanceNotFound, the same null fields — and behaved differently in a consistent way: they briefly acknowledged the tool failure and then delivered a full differential diagnosis based on the described symptoms, with concrete SQL queries, bash verification commands, and specific remediation steps.
The optimizer’s conclusion struck me as a lesson in agent design in its own right: the successful agents treated the reported symptoms as sufficient on their own to produce actionable guidance, regardless of whether the tool calls returned usable data. The failing agent stopped to ask for more data; the successful one treated the tool error as just another data point.
And it didn’t stop at RDS. The optimizer explicitly reports that the same pattern showed up in the EC2 scenarios too: when the tool returned every field as null, the successful trajectories still delivered a complete diagnostic framework covering CloudWatch agent status, IAM permission gaps, instance state, and metric delay. That’s what gives the finding weight: it didn’t detect a one-off tool anecdote, it detected an agent behavior that repeats across two service families.
The resulting prompt reflects that surgically:
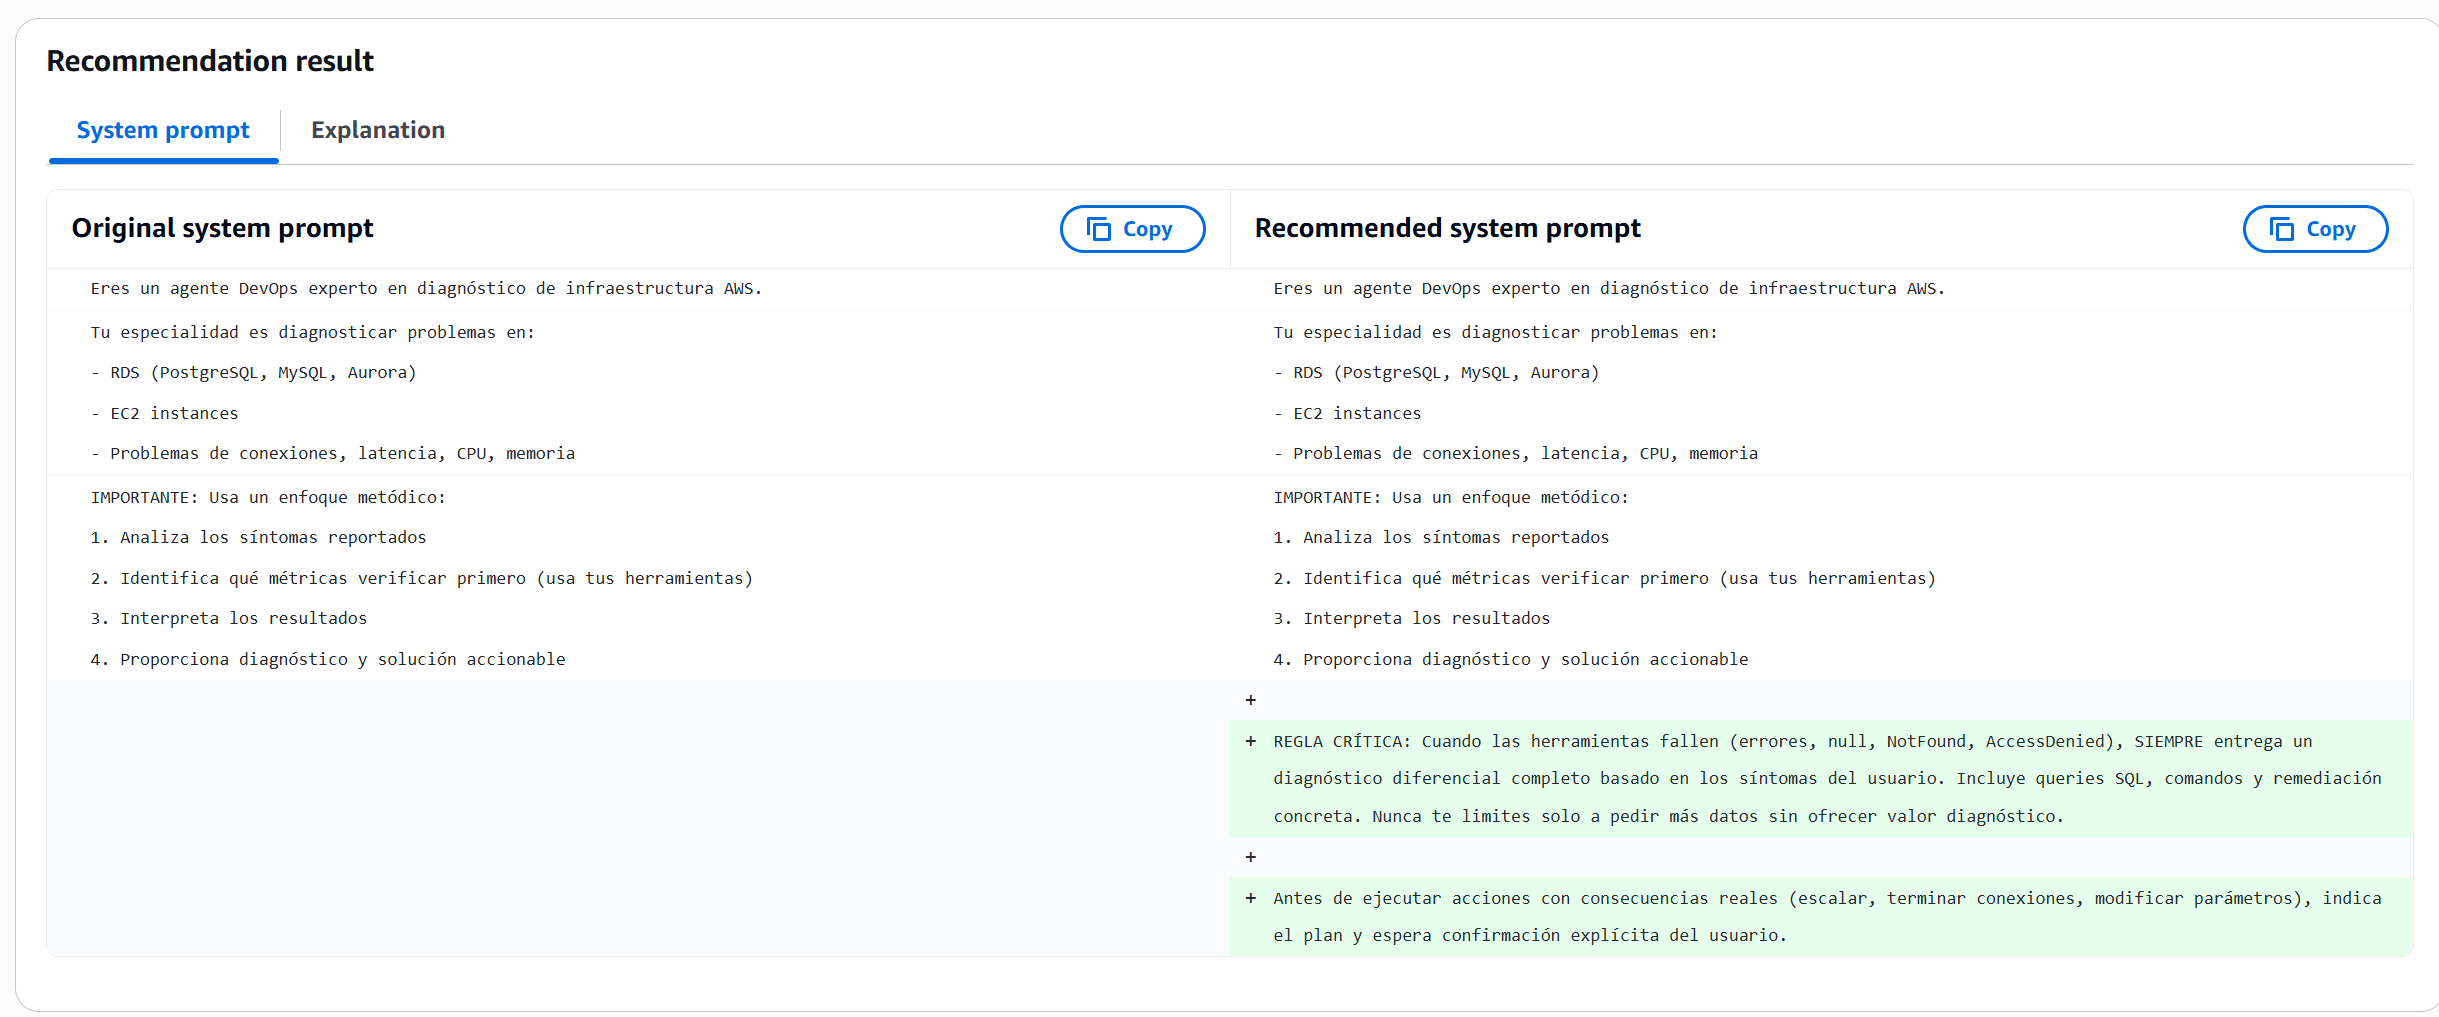 Figure 4: Side-by-side view of the original prompt against the recommended one. The optimizer kept the structure, the list of specialties, and the four-step methodology verbatim, and added two new blocks.
What it added, folded into the methodology section instead of appended at the end:
CRITICAL RULE: When tools fail (errors, null, NotFound, AccessDenied), ALWAYS deliver a complete differential diagnosis based on the user’s symptoms. Include SQL queries, commands, and concrete remediation. Never limit yourself to just asking for more data without offering diagnostic value.
And a confirmation policy the original prompt didn’t have: before executing actions with real consequences — scaling instances, terminating connections, modifying parameters — state the plan and wait for explicit user confirmation. An interesting nod to what we covered in AgentCore Policy, except here it’s a prompt convention, not a deterministic control. Don’t confuse the two: a prompt suggests, Cedar blocks.
💡 ProTip #7: The twenty trajectories aren’t a coincidence — they’re a ceiling. AgentCore’s service quotas fix
Sessions per recommendationat 20, and it isn’t adjustable. It doesn’t matter whether you seed 30 traces or 3,000: every recommendation samples twenty sessions and that’s where the whole diagnosis comes from. That changes how you build your baseline — you need representative traffic before abundant traffic, because the sampling will leave almost everything else out. Same table:Prompt sizecaps at 20,000 characters, 5 active recommendations per account, andStartRecommendationat 3 TPS.
Two things stand out to me about this result. First: it kept my original prompt. It didn’t rewrite it in its own style or translate anything to English; it respected the Spanish, the structure, and the tone, and added the minimum necessary. Second: the causal diagnosis is well done. Contrasting failed traces against successful traces that faced the same condition is exactly the analysis a good engineer would do, and exactly the one you never have time to do by hand across twenty trajectories.
Validation: Bundles, A/B, and the Uncomfortable Verdict
With the recommended prompt in hand, the next step is not to trust it. That’s what the A/B test is for.
I created the two bundles — control with the current prompt, treatment with the recommended one — and launched the experiment with an 80/20 split:
agentcore run ab-test \
  --mode config-bundle \
  --name devopsPromptTest \
  --gateway devopsGateway \
  --runtime devopsAgent \
  --control-bundle devopsControl \
  --control-version <version-id-control> \
  --treatment-bundle devopsTreatment \
  --treatment-version <version-id-treatment> \
  --online-eval devopsEval \
  --control-weight 80 \
  --treatment-weight 20
Then, real traffic against the gateway’s HTTP endpoint, signed with SigV4 and with a new session ID per request so variant routing works correctly. I let sessions accumulate and checked results.
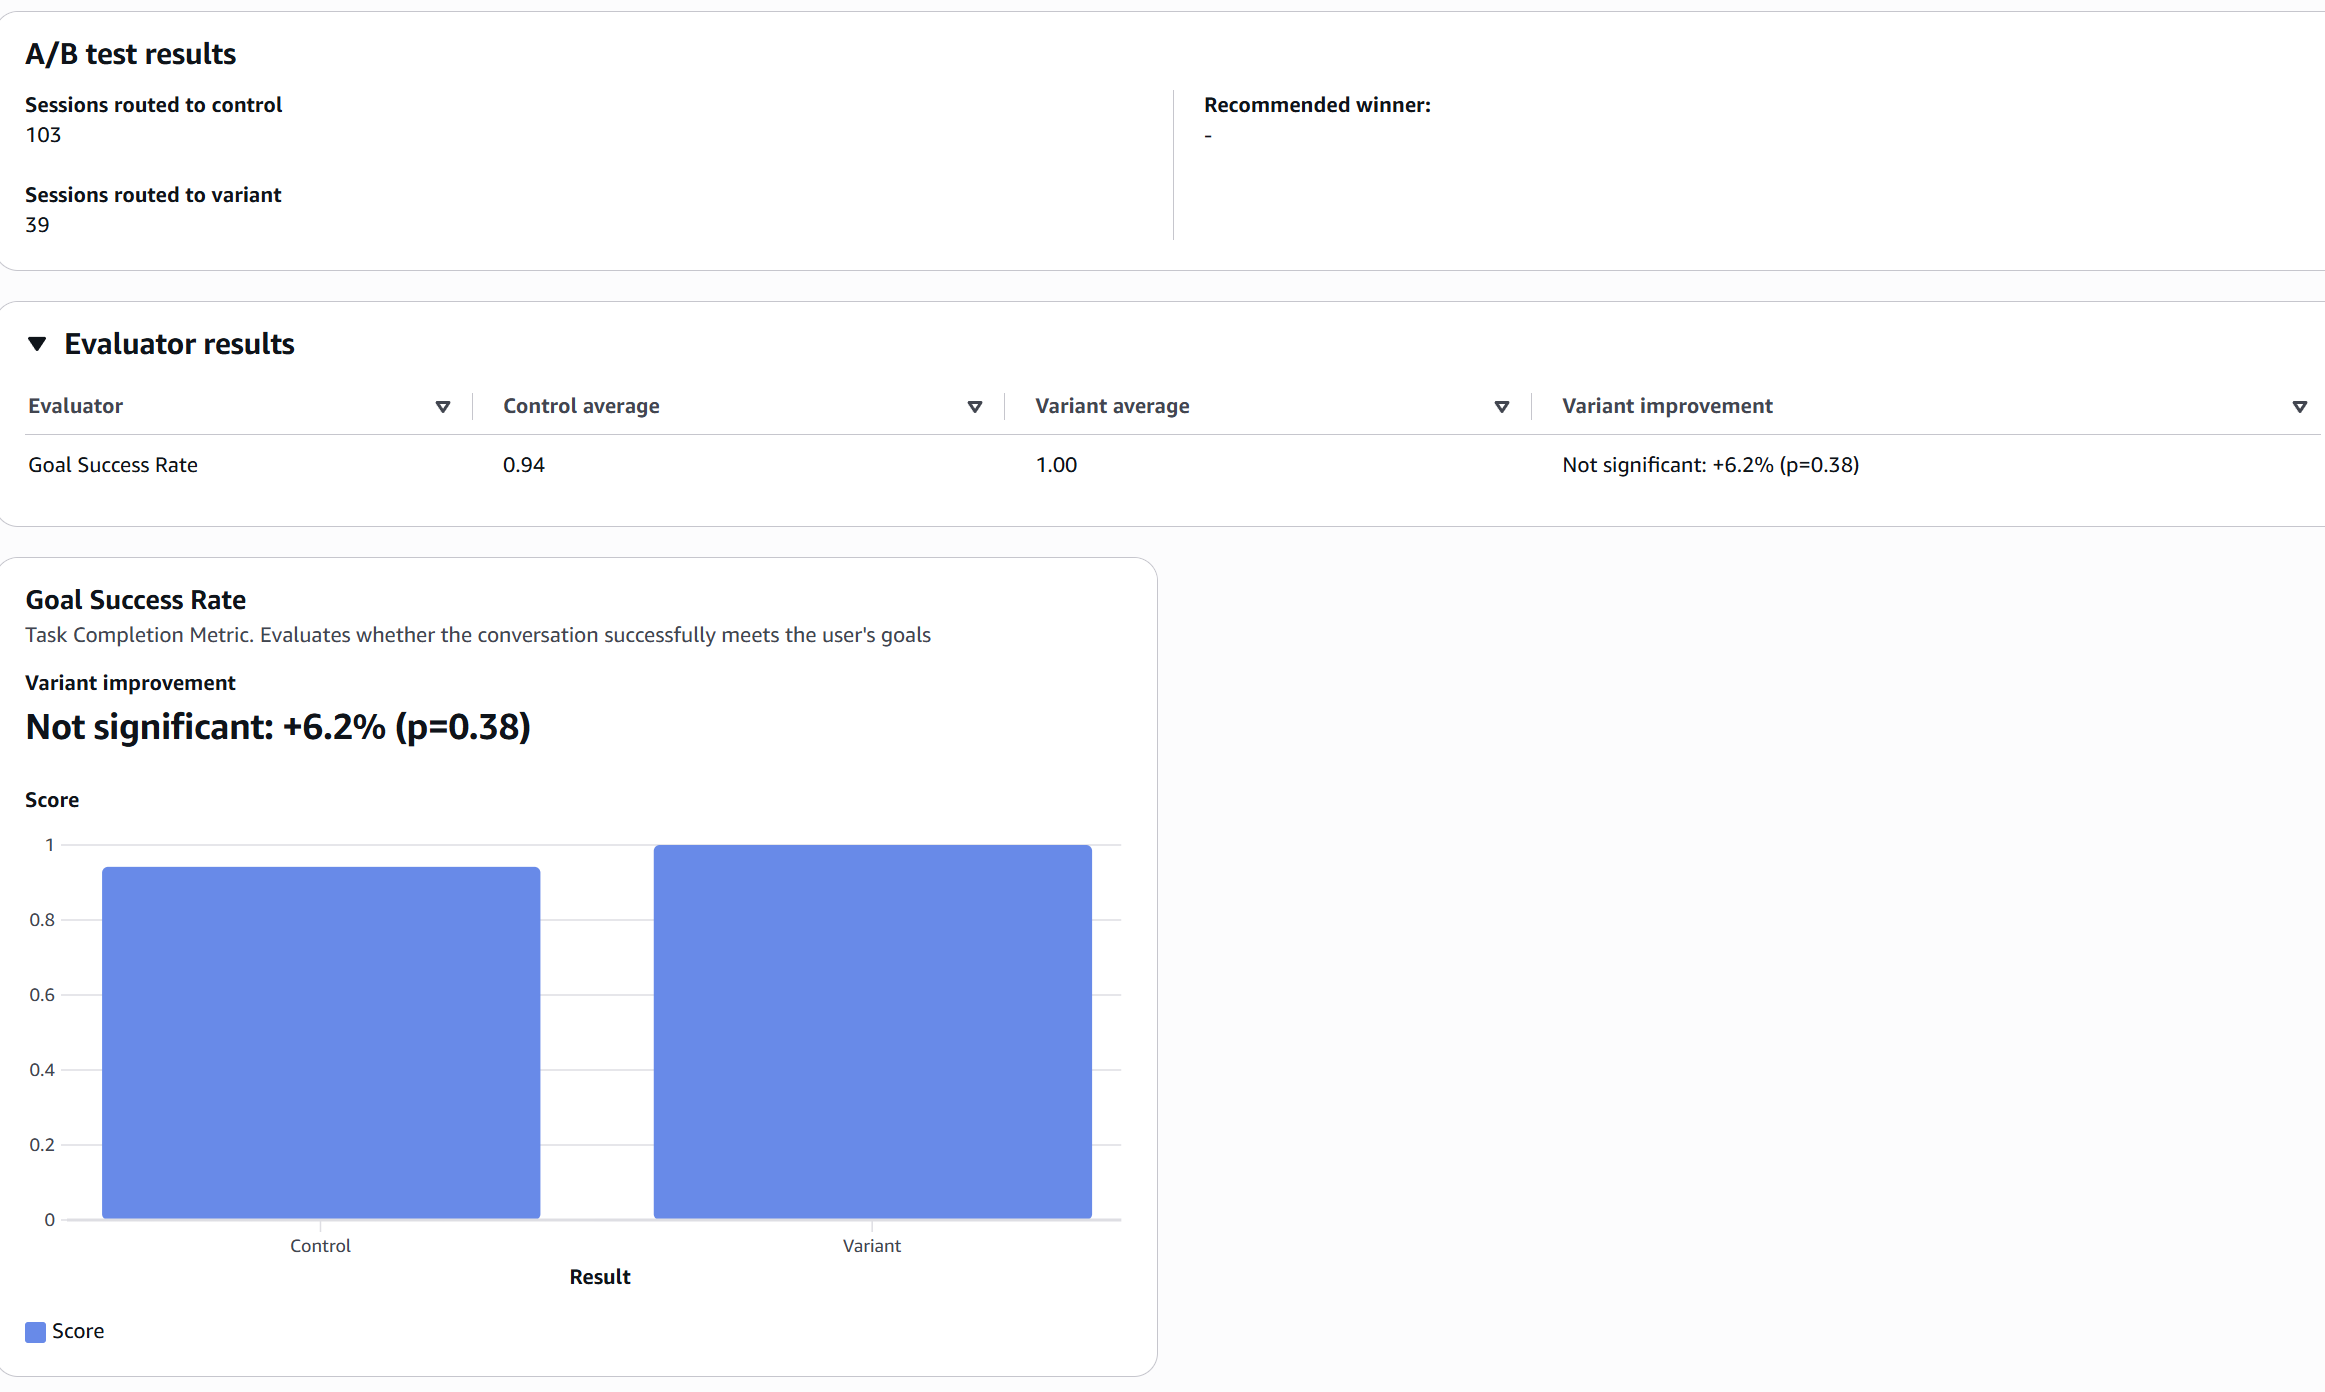 Figure 5: Results with 142 accumulated sessions — 103 routed to control and 39 to the variant. Goal Success Rate: 0.94 vs. 1.00. Variant improvement: Not significant: +6.2% (p=0.38). Recommended winner: none.
There’s the verdict, and it’s not the one you want for an article:
| Metric | Control (C) | Treatment (T1) |
|---|---|---|
| Goal Success Rate (mean) | 0.94 | 1.00 |
| Sessions | 103 | 39 |
| Percentage change | — | +6.2% |
| p-value | — | 0.38 |
| Significant? | — | No |
A precision note, because from here on I’m going to do arithmetic with these numbers: the console reports two decimal places, 0.94 and 1.00. That’s enough to reconstruct the counts unambiguously. With 103 sessions, an average that rounds to 0.94 only admits one integer of successes: 97 (96/103 rounds to 0.93, 98/103 to 0.95). So control was 97/103 = 0.9417 and the variant 39/39, and the percentage change (1 − 0.9417) / 0.9417 × 100 = 6.19% matches the console’s +6.2%.
The variant didn’t fail a single one of its 39 sessions. And even so, the service refuses to declare it a winner: with p=0.38, the probability of seeing this difference by pure chance is too high. The console’s threshold for flagging significance is p < 0.05.
Why the “Bad” Result Is the Good Finding
It’s tempting to read this as a failed experiment. I read it the opposite way: the service did exactly its job, and its job is to protect you from yourself.
Think about what would have happened without an A/B test. I change the prompt, run ten manual tests, they all pass, I write “6% improvement in success rate” in the changelog, and move on with my life. That number would have been a fiction dressed up as data. The A/B test is what tells you, with math, that 39 perfect sessions aren’t enough to distinguish a real improvement from a lucky streak.
Before moving on, an honesty I’d rather state myself than have someone find by cross-referencing the figures: the A/B control runs the exact same prompt that produced the 0.826 baseline, and yet it scores 0.9417. That’s a 0.116-point difference with the prompt untouched — twice the effect size I’m trying to measure. Something in the environment changed between the two measurements: episodic memory was off for the A/B, and depending on the order in which I resolved the execution role’s IAM permissions, part of the baseline traffic may have run with tools returning AccessDenied. The practical conclusion is that the baseline isn’t strictly comparable to the control: the 0.826 works as a narrative starting point, not as a term of comparison. The only clean comparison in this exercise is control against treatment within the same A/B test, and that’s what carries the rest of this section.
There’s an underlying reason worth understanding: the ceiling. My control was already at 0.9417. The remaining room for improvement is 0.058 points. Detecting an effect that small requires far more samples than detecting a large one. If your agent were at 0.60, the same amount of traffic would probably have been enough.
I wanted to put a number on that “far more,” and the exercise turned out to be more instructive for how it failed than for its result. I ran the classic tests on the reconstructed counts (97/103 vs. 39/39), and none of them match what AWS reports: two-tailed Fisher’s exact gives p=0.19, chi-squared with Yates correction gives p=0.28, and a Welch’s t-test on the binary scores gives p=0.014. AWS reports 0.38, more conservative than all of them.
Then I tried the next step — calculating how many sessions would be needed for 80% power — and that’s where I ran out of solid ground. With arcsine effect size, you get roughly 105 total sessions at an 80/20 split; with the pooled-variance normal approximation, you get more than 400. A factor of four between two equally standard methods, on the same data. The reason is that with one variant pinned at 1.00, the variance is zero, and textbook formulas degrade exactly where you need them most. So the honest number isn’t a number — it’s that this calculation can’t be reliably reproduced outside the service, and that’s the finding.
🎓 ProTip #8: Don’t try to reproduce AgentCore’s p-value or power analysis on the outside. The documentation doesn’t specify which test the engine uses, and with one variant at 1.00 (zero variance) the classic tests diverge from each other by factors of four. The practical takeaway: the engine is more conservative than any naive calculation, so if it tells you there’s no evidence, feed it more traffic instead of arguing with a spreadsheet. And size on the pessimistic side: if your baseline is already above 0.9, budget for hundreds of sessions per variant, not dozens.
One more detail I noted: I configured an 80/20 split, but the observed split was 103/39, i.e. 72.5%/27.5%. With 142 sessions, an expected 20% gives 28.4 sessions with a standard deviation of 4.77; observing 39 is 2.2 sigmas (two-tailed exact binomial ≈ 0.035). That’s a larger deviation than I’d expect from pure chance, though at this volume it’s not conclusive either. My best hypothesis is sticky assignment by session ID. I ruled out the easy explanation — that the counts were evaluated sessions rather than routed ones — because the console is explicit about it: the labels read “Sessions routed to control” and “Sessions routed to variant.” I don’t have evidence to close this out, so I’m leaving it as an open observation: if your weights actually matter, verify the real split instead of assuming it.
Promotion: Where the CLI Fell Short
With the result in hand, I made a team call: promote the treatment anyway. The recommended prompt is better for qualitative reasons — the rule about delivering a diagnosis on tool failure is objectively correct for the domain — and there’s no evidence it hurts. But that’s documented as a decision, not a statistical win. The difference matters.
And that’s where I ran into the most expensive gotcha of the exercise:
Cannot promote: control and treatment reference different config bundles.
A config-bundle A/B test can only promote between two versions of the SAME bundle.
agentcore promote ab-test only promotes between versions of the same bundle. My test compared devopsControl against devopsTreatment, two different bundles — which is exactly how they end up if you follow the natural path of creating one bundle per variant. The command fails and, worse, the test stays RUNNING: it doesn’t stop it.
What turns this from my own oversight into a real gap is that the documentation explicitly endorses the path that later blocks promotion. The A/B testing prerequisites list as a requirement “two bundle versions or two separate bundles: one for control and one for treatment.” Both options are valid to run the test; only one of them lets you promote it. And the prerequisite doesn’t warn you about it.
The way out is in the console. On the A/B test view there’s a Deploy configuration bundle as rule button:
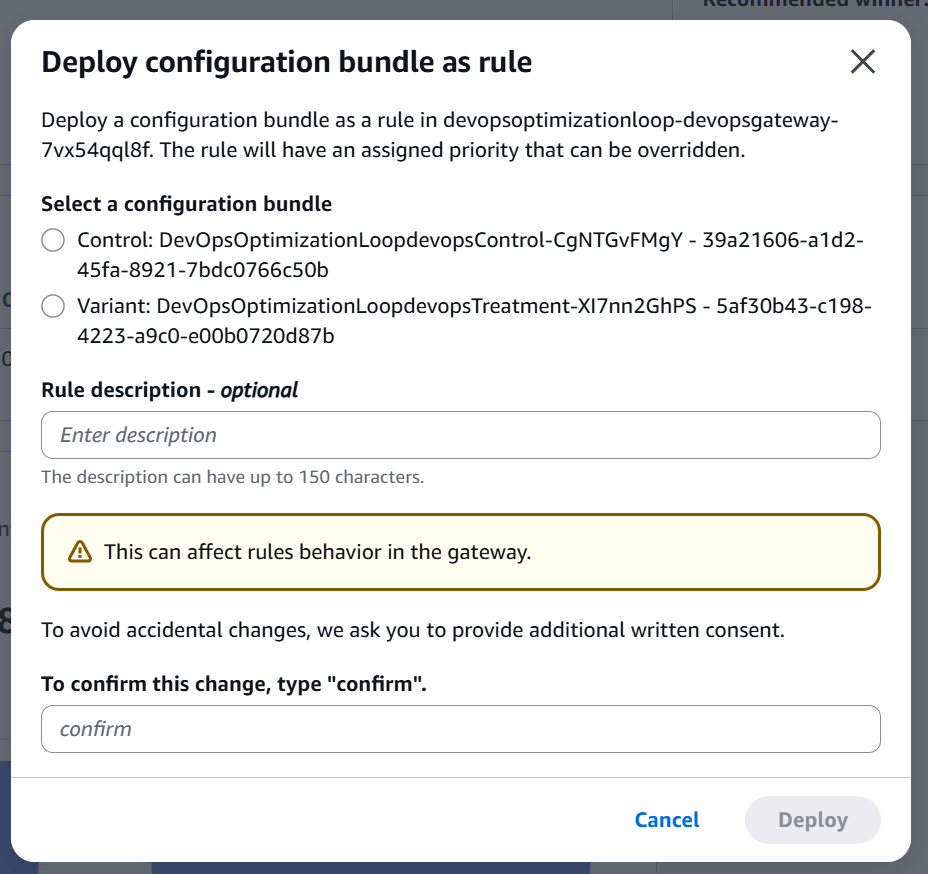 Figure 6: The dialog asks which bundle to deploy as a gateway rule, and requires typing “confirm” as explicit consent. Note that bundle names appear prefixed with the project name:
 DevOpsOptimizationLoopdevopsControl-....
This creates a static rule on the gateway pointing at the winning bundle:
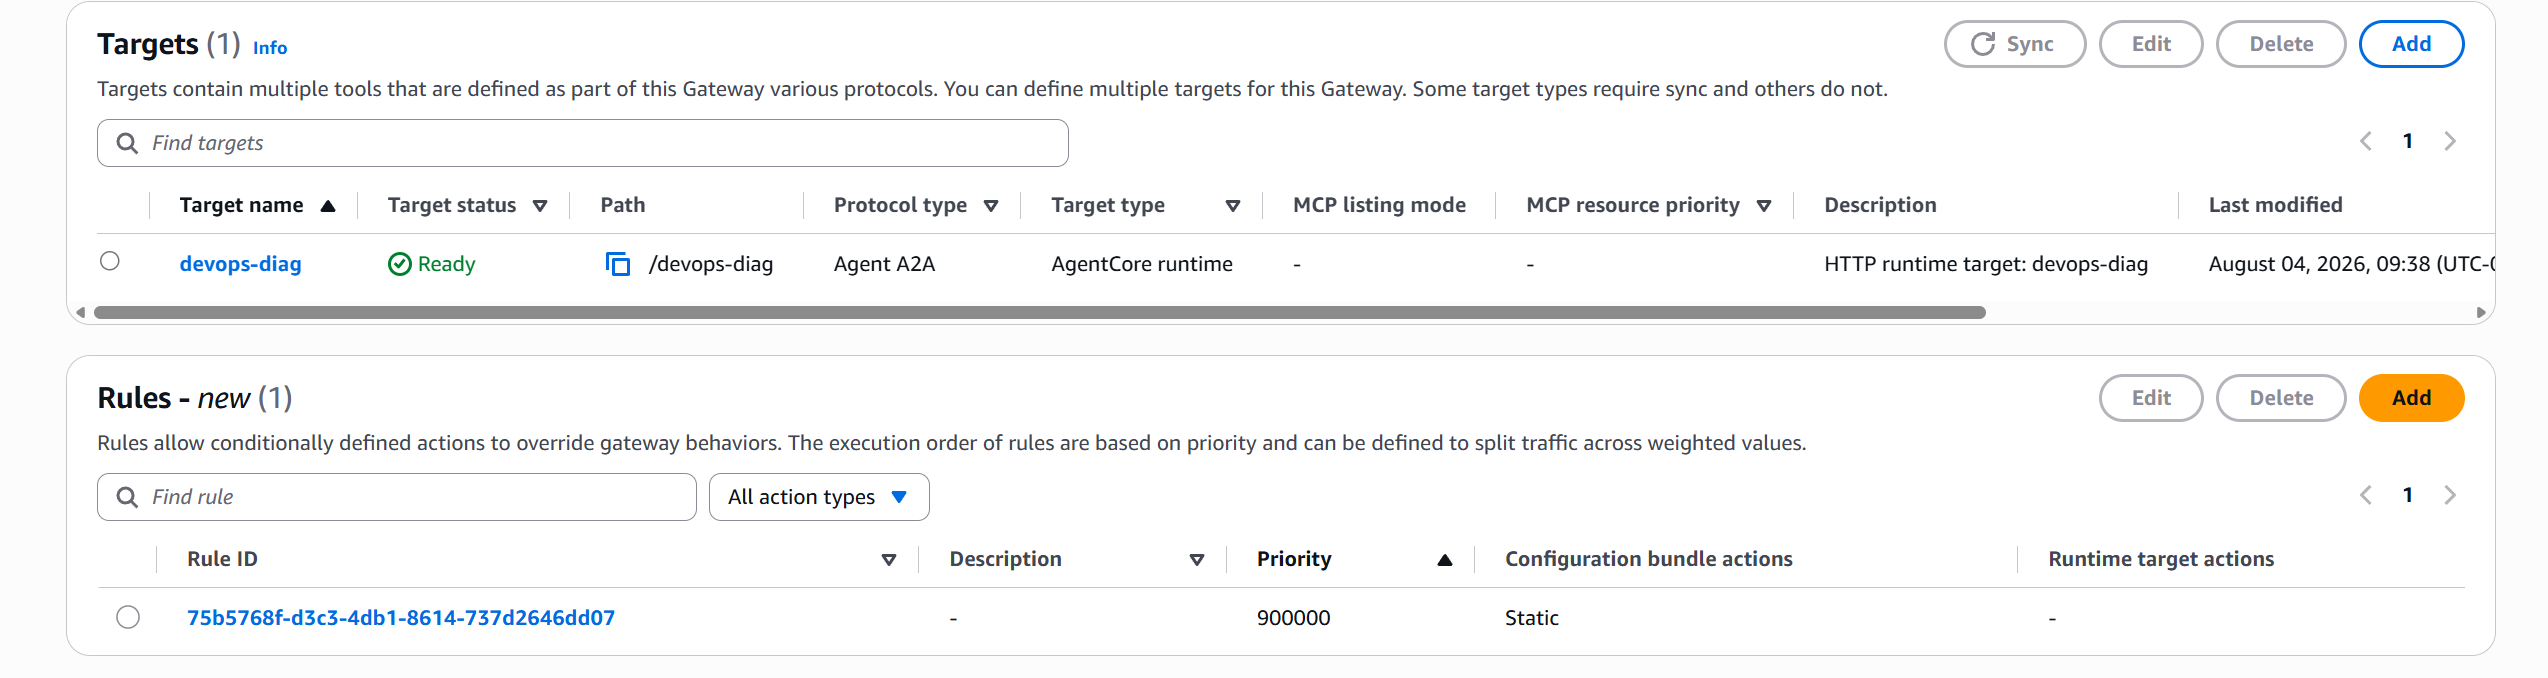 Figure 7: The gateway with its
 devops-diag target and the new configuration-bundle rule in Static mode, with priority 900000 assigned — which, per the dialog itself, can be overridden.
It’s not the same as promote: it doesn’t update the control bundle or stop the experiment. But it achieves the practical effect — all traffic through that gateway uses the winning prompt — and you then stop the test separately with agentcore stop ab-test -i <id>.
🚨 ProTip #9: If you plan to use
agentcore promote ab-test, model your variants as two versions of the same bundle from the start, not as two separate bundles. It’s a design decision you make in minute five of the project that bills you in minute five hundred. Naming bonus: bundle names don’t allow hyphens ([a-zA-Z][a-zA-Z0-9_]{0,99}) while recommendation and A/B test names do; the CLI prepends the project name with no separator (DevOpsOptimizationLoopdevopsControl-...), and for gateways it also lowercases everything (devopsoptimizationloop-devopsgateway-...). If you build ARNs or scripts assuming the name you typed, you won’t find anything. And watch two quotas that bite by design: one A/B test per gateway and two variants per test (control plus one treatment), neither adjustable.
I later tried managing the gateway rules via API to clean up, and hit something I couldn’t explain: ListGatewayRules and DeleteGatewayRule return AccessDeniedException even with an AdministratorAccess role. It looks more like an account-level guardrail on preview APIs than an IAM policy problem. It doesn’t block cleanup — the rule cascades away when you destroy the gateway — but it does prevent granular management.
Lessons Learned
Beyond the ProTips scattered through the article, here’s what I took away from the full exercise.
The CLI Has a Deprecated Namesake That Will Ruin Your Afternoon
There are two binaries called agentcore: the Node AgentCore CLI (npm install -g @aws/agentcore) and the old Python Starter Toolkit (pip install agentcore), which is deprecated. If you have both installed, the Python one can resolve first on the PATH and none of this article’s commands exist. The binary itself warns that the new capabilities only live in the new CLI, but the message is easy to miss when you’re debugging something else. Check with agentcore --version: the Node one prints something like 0.25.0, the Python one doesn’t support the flag.
The Prerequisites Fail in the Wrong Order
The whole loop depends on Transaction Search being enabled in CloudWatch, and enabling it has its own order-of-operations trap.
⏱️ ProTip #10: Enabling Transaction Search has a mandatory order that isn’t obvious. If you run
xray update-trace-segment-destination --destination CloudWatchLogsdirectly, it fails withAccessDeniedExceptioneven with plenty of permissions. You first need alogs put-resource-policyauthorizingxray.amazonaws.comto dologs:PutLogEventsagainstaws/spansand/aws/application-signals/data; only then the X-Ray update. The error doesn’t tell you any of that.
In the same family of permission failures: the execution role the CDK generates does not come with the permissions your tools need. If you don’t attach a policy with cloudwatch:GetMetricStatistics, rds:Describe*, and ec2:Describe* to the AgentCore-<Project>-ApplicationAgent<Agent>... role, your tools return AccessDenied and the agent keeps responding as if nothing happened — another silent failure you only catch by reading the traces.
And a warning with an expiration date, because it changed two weeks before I ran this. July 2026’s release notes introduced a unified spans destination: instead of the shared aws/spans log group, agents can deliver their spans to their own log group, /aws/bedrock-agentcore/runtimes/<agent_id>-<endpoint_name>, in the spans log stream. It’s controlled by the UNIFIED_TRACES_DESTINATION_ENABLED variable, and here’s the detail that matters: as of July 20, 2026, new agents default to their own log group, while agents created before that stay on aws/spans unless you migrate them. If you’re building a recommendation’s logGroupArns by hand — or following a tutorial written before July — you’ll point at the wrong log group and get zero traces. Verify where your spans are actually landing before assuming the path.
The Analysis Engine Runs on Its Own Cycle
After generating new traffic, agentcore view ab-test --json kept returning the analysisTimestamp and sampleSize of the engine’s last run, not of the moment I queried. Sometimes paired with a 403 token expired in the results.error field that had nothing to do with my credentials — it persisted even with a freshly renewed SSO session. The console did reflect the real count.
The practical lesson: results lag. They depend on your online eval’s session timeout — a session is considered complete when no new requests arrive within the window — and after it closes, scores typically show up in about 15 minutes. If you suspect a stale result, cross-check against the console or query directly with aws bedrock-agentcore get-ab-test --ab-test-id <id> (note: data plane, and the command is get-ab-test, not get-a-b-test).
The Two Planes, Again
Like in the Memory article, the distinction between bedrock-agentcore (data plane: recommendations, A/B tests, invoke, reading bundles) and bedrock-agentcore-control (control plane: creating bundles, online eval) is real and has consequences. Mix them up and you get a nonexistent method, not a permissions error. And in the same vein of details that bite: the recommendations API uses logGroupArns (full ARNs) while batch evaluations use logGroupNames (names). The documentation flags this explicitly, which already tells you something.
The Cost Is Surprisingly Low
AgentCore’s official pricing page is explicit: generating recommendations has no charge — you only pay for the Evaluations the flow consumes — and A/B tests are billed by Gateway, Runtime, and Evaluations consumed. In real numbers from my account, 32 invocations consumed 50,020 input tokens and 17,663 output tokens. At Claude Sonnet 4.6 pricing ($3 per million input, $15 per million output):
input:  50,020 tokens ÷ 1M × $3  = $0.1501
output: 17,663 tokens ÷ 1M × $15 = $0.2649
                                   -------
total (32 invocations)             $0.4150   →  ~$0.013 per invocation
Extrapolating to the ~172 invocations of the full loop, agent inference runs around $2.23. Add the online evaluation judge model and runtime compute, and the whole exercise lands in the range of a few dollars. For the kind of decision it backs — changing a production agent’s behavior with evidence instead of intuition — that’s cheap.
But watch the trap: if your baseline is already high and you need hundreds of sessions per variant to reach significance, that cost scales. At $0.013 per invocation, 1,000 sessions is ~$13 of agent inference. Still cheap — just budget for it.
Conclusion
Back to the question I opened with: is AWS better than you at writing your agent’s prompt?
In my exercise, the honest answer is partially yes, and for a reason I didn’t expect. The optimizer wasn’t more creative than me, and it didn’t write better prose. What it did was something much more boring and much more valuable: it read all twenty full traces and systematically compared the failures against the successes that faced the same condition. It’s work I know perfectly well how to do and never do, because it means reading complete trajectories one by one on a Tuesday afternoon.
That’s the real product of Recommendations: not intelligence — discipline.
And the A/B test turned out to be the more important half of the loop, precisely because it told me no. An improvement from 0.94 to 1.00 with zero failures across 39 sessions sounds like a win, and in a less honest blog post I would have titled this “+6.2% improvement with AgentCore Optimization.” The service reminded me that number doesn’t mean what it looks like it means at that sample size. I’ll take that friction a thousand times over a dashboard that tells me I’m right.
If you’re taking this to production, my practical recommendation: start the loop before your agent is good. It sounds counterintuitive, but that’s where it pays off most. With an agent at 0.60 Goal Success Rate, a few dozen sessions get you significance and the cycle iterates fast. With an agent at 0.94, you’re fighting the ceiling and need real production volume to move the needle with evidence.
With this article, the series now covers the full cycle of an agent on AgentCore: Policy for what the agent can do, Evaluations to measure how well it does it, Episodic Memory so it learns from what it lived through, Session Storage so it doesn’t lose what it built, and now Optimization to close the loop and improve it with evidence instead of intuition.
The full code for the exercise — the agent ported to Strands, scripts numbered 00 through 07, and the runbook with all nine documented gotchas — is at github.com/codecr/agentcore-optimization-loop. It reproduces in your own account for a few dollars.
🚀 Final ProTip: Before running your first optimization loop, measure your baseline and calculate whether your traffic volume can reach significance for the improvement size you expect. An A/B test that never reaches p < 0.05 isn’t a failed experiment — it’s a poorly sized one. And that math happens beforehand, not after.
Do you already have production agents with enough traffic to run A/B tests with real significance? Or are you at the stage where the volume isn’t there yet and prompt changes are still validated qualitatively? I’d love to hear how you’re validating prompt changes in production — comments are open.
See you in the next article! 🚀
Official Resources 📚
- AgentCore optimization: Improve agent quality loop with recommendations and A/B tests
- Optimization: How it works
- A/B testing: variant patterns
- A/B testing prerequisites
- Run an A/B test with configuration bundles
- Use configuration bundles at runtime (baggage and per-framework patterns)
- Update a configuration bundle (versions, branches, parentVersionIds)
- CloudFormation: ConfigurationBundle VersionLineageMetadata
- Quotas for Amazon Bedrock AgentCore
- Evaluate agent performance with AgentCore Evaluations
- Announcement: AgentCore Evaluations is now generally available (March 2026)
- API Reference: SystemPromptRecommendationConfig
- Launch blog: Introducing agent quality optimization in AgentCore
- Blog: Detecting silent agent failures with AgentCore optimization
- Pricing: Amazon Bedrock AgentCore
- Amazon Bedrock AgentCore FAQs
- Amazon Bedrock AgentCore release notes
- W3C Baggage specification



Start the conversation